Friday, January 27, 2017

Mistakes made today NVDA


NVDA 1/27/17


The night before this trade I was looking at charts and saw NVDA, right away I put this stock on watch not bothering to examine it more closely. I liked the flat breakout look it had and thought if this pops over yesterdays close OR goes r/g this could be a nice long, no questions asked. Here is the chart with todays action already on it

Now what did I not see? Well what I did not see was that it had already made a bit of a V move from the support level. The daily didn’t look too extended in any way but when you see a move like that from support you should examine closer.

What would have been the ideal play for this stock intraday? What I would have wanted to see in a perfect world would have been a red open and set up for the r/g move. Or maybe a solid push out of the gate and a clean nice orb type play or flag with a clear area of support.

REMEMBER THIS: THE MORE IN DOUBT YOU ARE OF A SET UP THE MORE THINGS IT HAS GOING AGAINST IT THE MORE CONFIRMATION OR BETTER SET UP YOU SHOULD WANT TO SEE.


What happened intraday:


So now we look at the intraday chart. What do we see here. We see a move over resistance, a nice move which got me interested. Unfortunately a flag started forming a little far away from support , which would normally be considered a high tight flag because of the daily having moved a bit already was not a green light. Instead I took the trade in anticipation of the break.  What would have been the better move . Well since I had taken the trade already I think being the higher risk trade that it was , the smart decision would have been to keep my stop really tight , in other words, if it didn’t break out right away. Get the hell out! Instead I held until it broke the much lower support. Which it eventually did being that it turned into a lower high type short.

 What was this play REALLY?

If you look at the daily you will see that it had passed resistance already , it wasn’t crazy extended so was it a short play? Not really. It simply needed to pullback to then setup for a r/g type play which as you see it eventually did!

Lessons learned from today

So today proves that you still need to write out the plans , maybe use a little more detail in your descriptions of what you want to see happen. Second and this is way more important if you have a chart on the daily side that looks long and you get in at the open, it then stops you out but later on it sets up again. You need to take it. If your daily big picture idea is still in play there is no reason to look the other way. As seen on the chart below there was a great chance to get back in and go for the win, the huge win which would have wiped out any previous loss. This is the most important lesson in trading I think. 


Tuesday, December 27, 2016

watchlist 12/28

AKAO----I’m liking this one for a r/g type move. I don’t think I’ll take it any other way. Not too used to this look right here.


CNAT---Looking for a few scenarios here. Could see a r/g here but I’m not looking forward to that. If I didn’t take the long already I should not get into it this high. I am actually looking for a further extension for a lower high short. Curious also to perhaps see an overextended gap down move to green and then a fade back down. Could go higher and keep on going but I wont be interested for the long at this stage


CRC---This one has room till well over 21. I would love to see a r/g but we may also see a push out of the open for a long (as long as it is not too close to resistance) Or we may see a gap up pull back for the entry long.


GPOR---If we break below this base I will look to get short.


X--- still waiting for the breakout


UA---I think this one still has room to go lower. Has been slowly grinding down. Could have one more strong short day


YELP---Would like to see a r/g here.


Trade of the day HIIQ

Ok so those who saw my watch list from last night saw that HIIQ was one of the stocks on the list. My idea for this was purely a short set up. If you read my blog you will see that i had a feeling it could have gone up more but I would not try to short it until it showed me a lower high. And that is exactly what it did today. Here is an annotated chart of what happened intraday


Monday, December 26, 2016

Watchlist 12/27

Hope everyone had an awesome christmas and ready for an incredible pnl positive 2017! Here is my watchlist for tomorrow Tuesday the 27th of December

X---I like this one as it has been holding support. I would like to see this have a nice push at the open and a pullback for an entry. As long as we hold this 35.50 area.


TWTR---Perhaps a day 2 push here. Either on a r/g or a straight out push at the open and pullback. Remember this is in a downtrend so it could just as well be weak at the open and go right back to its original downtrend. Just watch which way the strength is at the open.


SHLD---Call me crazy but I think we have a day 3 short here. If we gap down or show any signs of strength to the longside i will trade it long. It has got to prove me wrong though. Any G/R and we could go lower.


WSM---Notice how we are at a nice support level now after two strong days down. I am not looking for a short here at all. I am looking either for strength at the open and a push higher or a fake breakdown and higher low set up or any long set up for that matter for the long. 


PGNX---We could go higher here. Either r/g or a push at the open with a controlled pullabck for the entry. Could see a new move higher


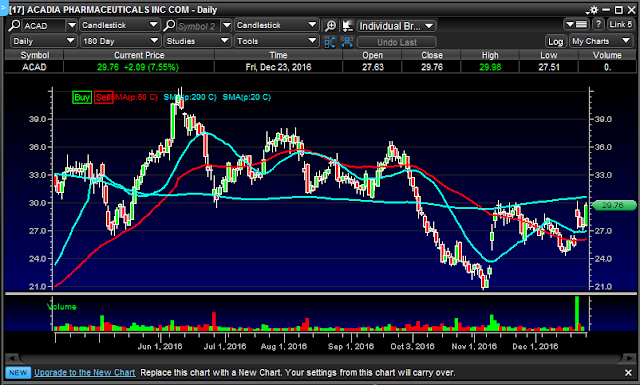
ACAD---Tricky one here but I want to see what happens. Strong move on Friday but we have the ma200 right above. I don't want to buy into it but if we see a red move at the open I would like to see a r/g type play here


HIIQ---Last pick for tomorrow 3 days up already so I am not longing this anymore however it could very well go higher but after so many days up we need some sort of a pullback soon. Looking for a push higher and short on the lower highs. If you want to be safer wait for the break of the trend and get in on the new downtrend. 


Wednesday, December 21, 2016

Watchlist 12/22

Here is my watch list and plans for tomorrow 12/22

GME---This one has been slowly inching up and is at its third attempt to break out. Even though we have had a few days up already I believe there is a chance we break out tomorrow. If not tomorrow then perhaps on Friday. R/G scenario is good here. We may also see some sort of a push out of the open and pullback. Just be careful getting in too close to the resistance area. Just my two cents


X---This is one that along with other steel companies has been having some nice moves lately. We have been seeing a nice base forming from the intraday chart. I believe we can see a r/g type move respecting the support levels. Maybe a push out of the open followed by an opportunity to get in. Be patient if the move doesnt happen right away. We may also see a base formed and a move sideways for a while until the later afternoon move.


CXW---I believe we see a nice short here. Its got that nice rounding down look. It has the potential to go quite a bit lower. Looking for a g/r type play. Slight gap down and pullback is also  a possibility


RLGY---Could have another breakout day here of this mini flat top. Over 27.30, pretty straight forward move here


TWLO---Looking for a r/g play here. Just be careful with the ma50 above. If this gaps up too much I may look for a short off a lower high 


LABD---Some resistance above to be careful not to get in too close to that level. However , if a r/g is seen the play may be a nice one. If not wait for a break of the resistance area. We may also gap up slightly and pullback for a long set up later on


Upper wick into resistance or overextended set up

So It's been a while since I have spoken about set ups in particular. That is because i am still developing as a trader and learning set ups as the days go on. My job as a trader is to be an expert at pattern recognition. It is of extreme importance if you are a discretionary trader such as myself, to be able to stare at as many charts as possible and ask yourself what happens if so and so happens. If you see a pattern repeated over and over you've got it! Add it to your file and whenever that same set up happens again you now have a plan. That is what it takes to be a successful trader. Most traders fail in my opinion because they simply don't have the desire or passion to look at the amount of charts it requires to actually ingrain those patterns into your mind. I personally could not envision as better way to spend my weekends :)

Today I am going to talk about the move into resistance after various up days. This could also be an extended move. The key here is that the stock has had many green days and the last day ended with a big upper wick. Meaning there was selling into the close. The examples I will show today are WTI and SGY. Here is a look at the dailies for the two as of today 1:30pm


So notice how yesterday WTI closed with a high upper wick. It started off the day strong but after the lower highs the short signal was given,.If you didnt get in yesterday based on my watch list you had the chance to get in today and I will tell you how. SGY on the other hand was also overextended but it ran into an area of resistance as you can clearly see on the chart.  I will also show you how to trade this chart , which happens to be exactly the same set up as WTI. 

Lets say its the night before so in this case, 12/20/16 you are scanning and you see two great stocks with big upper wick closes which look to be overextended. What do you say to yourself? How do you plan your trade for the next day. First off you know the next day is going to be a short play. Of course nothing is guaranteed but why would you plan for a long. The goal here is to get into the short play as close as you can to the resistance area, So lets say SGY had gapped up this morning over 12 and showed weakness right away. You;d be in RIGHT away because it was close to resistance. Unfortunately that did not happen. What you saw was a flat open and a push higher. Remember the overall set up is NOT a long so that means even if you see a long set up you do not get in. Another important point to mention here is do not simply short at a pop too far away from the resistance area. Wait for the obvious short set up ( if it doesnt reach the resistance zone ). In this case we never reached the resistance zone but when you begin to see lower highs and a crack of a base you know its time to hit that short. If you didnt quite get it there you had another chance once a bear flag formed and cracked. Here is a look at the intraday chart with some annotations.


What about WTI? Well as you can see it was very similar. The only difference here is that there was no big time resistance. What you had here was an obvious overextended chart with a top formed yesterday which would be used as the resistance.  This one didnt even come close to its resistance but as we did on SGY the lower highs could be used as an entry short signal since probability was on your side. No reason to short too quickly out of the gate but once that lower high started to fade off that was your sign of weakness. It worked all day! 


Tuesday, December 20, 2016

Watchlist Review 12/20

So let's chat about the action of last nights watchlist. As always I will talk about how I could have written my watch list better because this is a big part of how I learn. Hope you guys are enjoying these posts.

MOMO---I had a few scenarios for this stock. The green to red scenario came to play here but wasnt quite the strong move of the day. The ma200 is what I will focus on more next time. Not simply the ma200 itself but levels of potential strong support. What we saw here today was somewhat of a fake breakdown on the g/r move followed by a powerful push higher that signaled we were in for a reversal. You could very well have waited for this reversal and gotten in long at the pullback before the continuation move in the direction of the new trend. So what could I have done better? Account for the fact that the ma200 was sitting right there and that it could be used as a support. Many times reversals will occur after a fake breakdown of a support level , this was the case here. Take a look at the intraday chart.


TRIP--- this was one that I had for a short but as you can see the gap up and extreme push out of the gate was enough to show I was wrong and that this was going to be a reversal day. A long entry was given at the flag on the 1min.


WTI--- now here was the big one today. As I said in my watch list blog last night this one could keep on going out of the gate, wait for the lower high situation for the short. And this is EXACTLY what happened. That is why it is so important to have your plan written out. 


TSEM---Not much happening here today. In the long run just a consolidation play here. Not much bias to either side. 

PIR---Another good trader today from the list last night. If you had a buy stop in you couldve gotten in pretty early but there were a few other entry options to get in. Not the best flags to get in but still worth the risk 


ATW---This was one more great pick from yesterdays list. Strong push here in the morning and an opportunity to get in on the sideways consolidation we saw right after 10am


GME---This one was a little tricky to trade because it pushed up at the open but then pulled back. This pullback could have been used to enter some more long as it never pulled back below the low of today. After that we made some higher lows and grinded up for the rest of the day. Not really a great trader